How to Analyze User Behavior on Shopify
Let’s talk about something that trips up almost every Shopify store owner at some point: you’re getting traffic, maybe even decent traffic, but you have no real clue what people are actually doing once they land on your store. Are they scrolling through five products and leaving? Are they adding stuff to cart and then just… vanishing? Are they confused by your checkout? You don’t know, because you’re not actually watching.
That’s what user behavior analysis is all about. It’s the process of understanding how real visitors interact with your store, not what you assume they’re doing, but what the data actually shows. And once you start paying attention to this stuff, you’ll be shocked how many “obvious” fixes you’ve been missing.
So grab a coffee, and let’s go through this properly.
Why Bother Analyzing User Behavior At All
Here’s the thing. Most store owners spend all their energy on getting traffic in the door. Ads, SEO, influencer shoutouts, whatever. And that’s important, sure. But if you don’t know what happens after someone lands on your store, you’re basically pouring water into a leaky bucket and wondering why it never fills up.
Behavior analysis tells you where that leak is. Maybe your product images aren’t convincing anyone. Maybe your shipping costs show up too late and scare people off. Maybe your mobile menu is broken and nobody can even find the products they came for. You won’t know any of this unless you actually look at how people move through your store.
The best part is that fixing these leaks is usually way cheaper than getting more traffic. You already paid for that visitor. Understanding their behavior lets you get more value out of every single one.
Start With Google Analytics 4 (GA4)
If you haven’t set up GA4 on your Shopify store yet, that’s step one, full stop. GA4 gives you the big picture stuff: where your traffic comes from, what pages people visit, how long they stay, and where they drop off in your funnel.
The metric most people ignore but really shouldn’t is the user journey through pages. Go into GA4 and look at your path exploration report. You’ll see how people flow from your homepage to collection pages to product pages, or maybe they skip your homepage entirely and land straight on a product page from an ad. This tells you a lot about how to structure your site and where to put your best content.
Also keep an eye on engagement rate and average engagement time per page. If people are landing on your product pages and bouncing in under ten seconds, something’s off. Maybe the page loads slowly, maybe the first thing they see doesn’t match what the ad promised, maybe your pricing feels off compared to competitors. GA4 won’t tell you exactly why, but it’ll point you toward the pages that need investigating.
Set up conversion events too. Track add to cart, begin checkout, and purchase as distinct events. This turns your analytics into an actual funnel instead of just a pile of page views, and it’s the only way you’ll spot exactly where people are falling off before buying.
Heatmaps Show You What Numbers Can’t
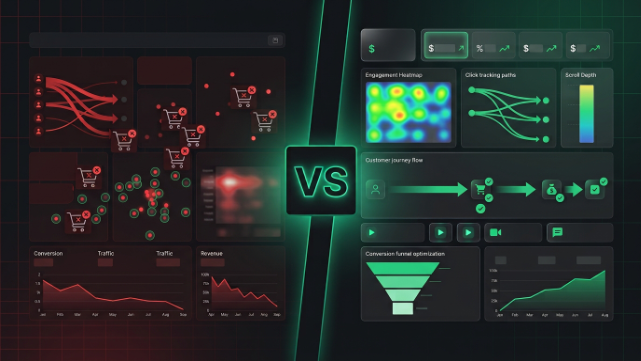
Numbers tell you that something’s wrong. Heatmaps show you what’s actually happening on the page itself. Tools like Hotjar, Microsoft Clarity, or Lucky Orange let you see where people click, how far they scroll, and where their mouse hovers before they leave.
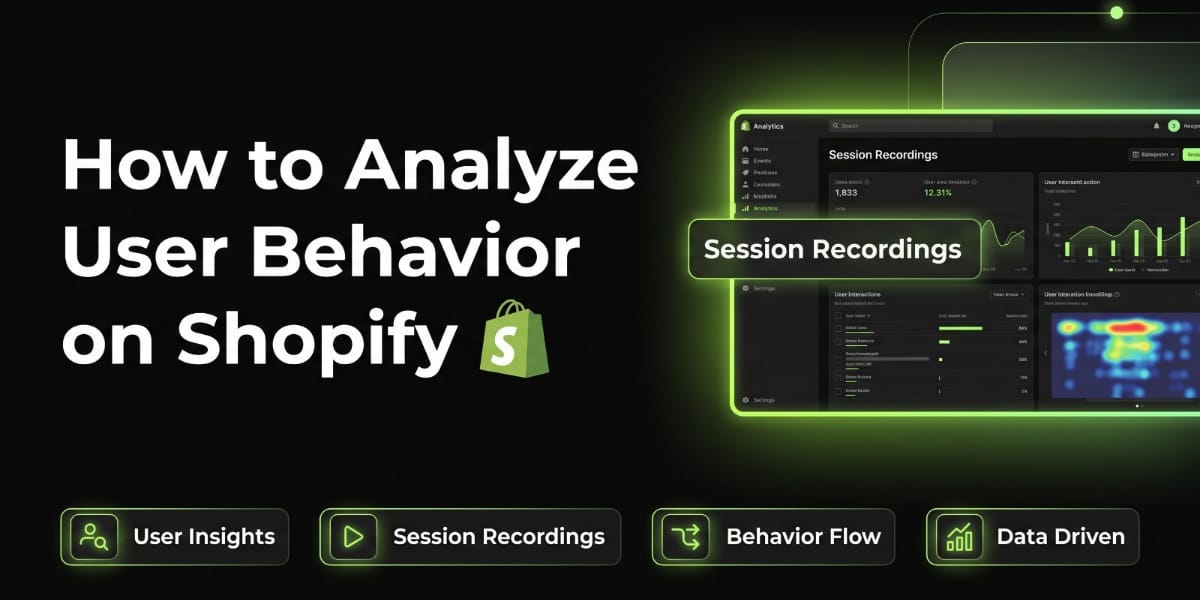
Microsoft Clarity is honestly a great starting point because it’s free and gives you session recordings too, not just heatmaps. You literally get to watch real visitors move through your store like you’re looking over their shoulder. It sounds a little invasive when you first think about it, but it’s completely anonymized and it’s one of the most eye opening things you can do for your store.
What you’re looking for in heatmaps is pretty simple. Are people scrolling past your “buy now” button because it’s placed too low? Are they clicking on something that isn’t actually clickable, like an image they think is a link? Are they ignoring your product description entirely and jumping straight to reviews? All of this tells you exactly where to focus your redesign energy instead of guessing.
Session recordings are even more useful because you get to see the actual frustration in real time. You’ll notice people rage clicking on a broken button, or repeatedly trying to apply a discount code that isn’t working, or getting stuck on a size chart that won’t load properly. These are the kinds of bugs that quietly kill conversions and that you’d probably never find just by staring at a spreadsheet.
Shopify’s Own Analytics Dashboard Is More Useful Than People Think
A lot of store owners skip right past their native Shopify analytics because GA4 feels more “professional.” But honestly, Shopify’s built in reports are great for quick, actionable insights, especially the ones GA4 doesn’t cover well.
Check your “Online Store Conversion Funnel” report under Analytics. It shows you the percentage of sessions that added to cart, reached checkout, and completed a purchase. This is one of the cleanest funnel views you’ll get without any setup work.
Also look at “Sessions by Device Type” regularly. If most of your traffic is mobile but your conversion rate on mobile is way lower than desktop, that’s a massive red flag that your mobile experience needs work. This happens more often than people expect, especially on stores that were originally designed with desktop in mind and never properly tested on phones.
The “Top Landing Pages” report is another one worth checking weekly. It shows exactly which pages people enter your store through, and cross referencing that with your conversion rates by page tells you which of your product or collection pages are actually doing their job.
Track Cart Abandonment Like It’s Your Job
Because honestly, it kind of is. Cart abandonment is one of the biggest indicators of where your store loses money, and Shopify makes it fairly easy to track once you know where to look.
Under Analytics, look at “Abandoned Checkout” reports to see how many people added products, started checkout, and then left. The average abandonment rate across ecommerce is somewhere around 70%, so don’t panic if you’re in that range, but you should absolutely be trying to bring that number down.
Pair this with a cart recovery app that captures why people are abandoning. Some apps let you add exit intent surveys asking a quick one-tap question like “what stopped you from completing your order?” You’ll be surprised how often the answer is something fixable, like unexpected shipping costs or a confusing coupon field.
Use Search Data To Understand What People Actually Want
Your on site search bar is basically a direct line into your customers’ brains. If you’re not tracking search behavior, you’re ignoring one of the richest sources of user intent you have.
Most search apps for Shopify, and GA4 too if you set it up properly, let you see what people are typing into your search bar. Pay attention to searches that return zero results. If a bunch of people are searching for “plus size” or “waterproof” and getting nothing, that’s a gap in your product lineup or your product tagging that you can fix immediately.
Also notice which searched terms lead to purchases versus which ones lead to a bounce. This tells you not just what people want, but what they expect to find and don’t, which is incredibly useful for planning future inventory or even just improving your product titles and descriptions.
Segment Your Users, Don’t Just Look At Averages
One mistake a lot of store owners make is looking at overall average conversion rate and assuming that’s the whole story. It’s not. A new visitor behaves completely differently from a returning customer. Someone who came from an Instagram ad behaves differently from someone who came from a Google search for your brand name.
Break your GA4 and Shopify data down by segments: new versus returning visitors, traffic source, device type, and even geography if you sell in multiple countries. You’ll often find that your overall average is hiding a huge problem in one specific segment, like maybe your Facebook ad traffic converts at half the rate of your organic traffic, which tells you either your targeting is off or your landing page doesn’t match what the ad promised.
Watch Product Level Behavior, Not Just Store Level
Zoom into individual product pages too. Some products will have naturally high add to cart rates but low actual purchase rates, which usually points to something in the checkout or pricing that’s putting people off at the last second. Other products might have great purchase rates once someone lands on the page, but very few people ever find that page in the first place, which is more of a discoverability or SEO issue than a conversion issue.
This distinction matters a lot because it changes what you actually fix. Throwing more traffic at a product with a bad conversion rate just wastes ad spend. Fixing the page first and then driving traffic is the smarter order of operations.
A Quick Word for Store Owners in Pakistan
If you’re running a Shopify store targeting the Pakistani market, a few behavior patterns show up again and again that are worth tracking specifically.
Cash on delivery still dominates buyer preference here, so track how your conversion rate differs between customers who see COD as an option versus those who only see prepaid options. If COD isn’t clearly visible early in the checkout flow, you’ll likely see higher drop-off simply because the customer assumes it’s not available and leaves.
Also pay close attention to mobile behavior specifically, since a huge chunk of Pakistani shoppers browse and buy through phones, often over slower or inconsistent internet connections. If your session recordings show people waiting on slow-loading pages before leaving, that’s a real and common issue here, not just a theoretical one.
If you’re running WhatsApp as a support or sales channel, track how many of your conversions are actually happening through WhatsApp conversations rather than the standard checkout flow. A lot of Pakistani buyers still prefer to confirm an order over WhatsApp before paying, especially with JazzCash or Easypaisa, so understanding this hybrid buying pattern will change how you interpret your “abandoned cart” numbers. Some of those aren’t actually abandoned, they just converted somewhere your analytics can’t see directly.
Turning All This Data Into Actual Action
Collecting data is the easy part. The real skill is turning it into decisions. Once a month, sit down and actually review your GA4 funnel, your heatmaps, your abandoned checkout report, and your search data together. Look for patterns that show up across multiple sources, because those are the ones worth prioritizing.
For example, if your heatmaps show people scrolling past your “add to cart” button, and your session recordings show hesitation on that same page, and your GA4 data shows a high bounce rate for that page too, that’s three signals pointing at the same problem. That’s where you start.
Don’t try to fix everything at once either. Pick the one or two biggest leaks, fix them, and then go back and measure again. Behavior analysis isn’t a one-time project, it’s an ongoing habit that keeps your store improving month over month.
Wrapping It Up
At the end of the day, analyzing user behavior on Shopify isn’t about drowning yourself in dashboards and reports. It’s about actually understanding the real people clicking around your store, what’s frustrating them, what’s convincing them, and where you’re losing them right before the sale. Start with GA4 for the big picture, layer in heatmaps and session recordings for the details, keep an eye on your native Shopify reports for quick wins, and don’t ignore search behavior or segment level differences.