How to Build a Shopify Store That Loads in Under 1.5 Seconds (Case Study)
Most people who build a Shopify store spend weeks choosing the right theme, writing product descriptions, setting up payment gateways, and getting everything looking perfect. Then they launch, run some ads, and wonder why the conversion rate is disappointing.
What they almost never check is how fast the store actually loads.
This is a case study about a real ecommerce store, a mid-sized apparel brand selling through Shopify, that was doing everything right on paper but struggling with performance, rankings, and conversions. Their store took nearly 6 seconds to load on mobile. Their Core Web Vitals were all failing. Their Google organic traffic had been declining for months.
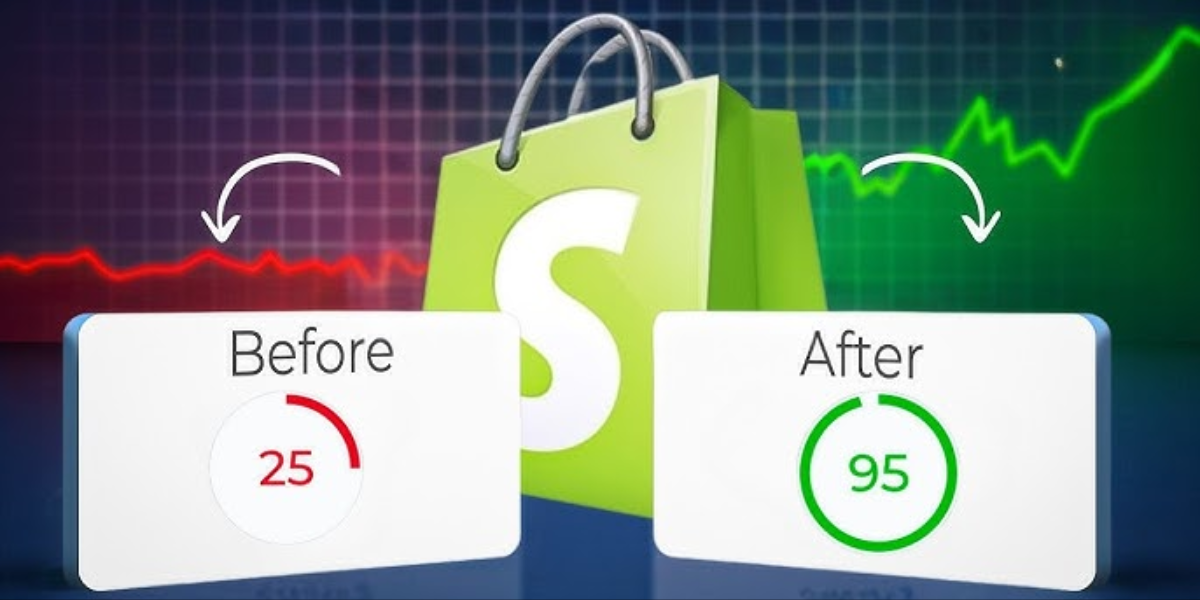
Over the course of eight weeks, they went from a 5.8 second load time to a consistent 1.4 seconds on mobile. Their PageSpeed score went from 24 to 91. All three Core Web Vitals moved from failing to passing. Organic traffic increased by 41% over the following two months. Conversion rate improved by 19%.
This is the complete story of how they did it, including every step, every decision, and every result. Whether you are starting a new store or trying to fix an existing one, the principles here apply directly to your situation.
The Starting Point: What the Store Looked Like Before
The store had been running for about two years. It had grown to roughly 800 product SKUs across several collections. The team had added apps over time to handle reviews, loyalty points, email capture, upsells, live chat, and currency conversion. They were using a popular premium theme that cost $280 and had excellent design reviews.
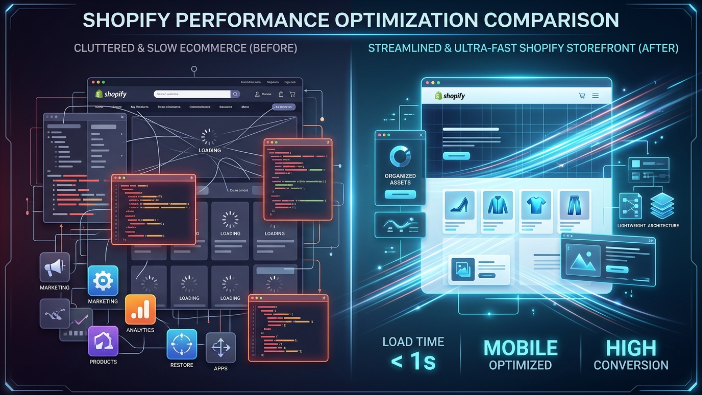
From a visual standpoint, the store looked great. Clean layout, beautiful product photography, clear calls to action. Any reasonable person looking at it would say it was a well designed store.
But under the hood, things were a mess.
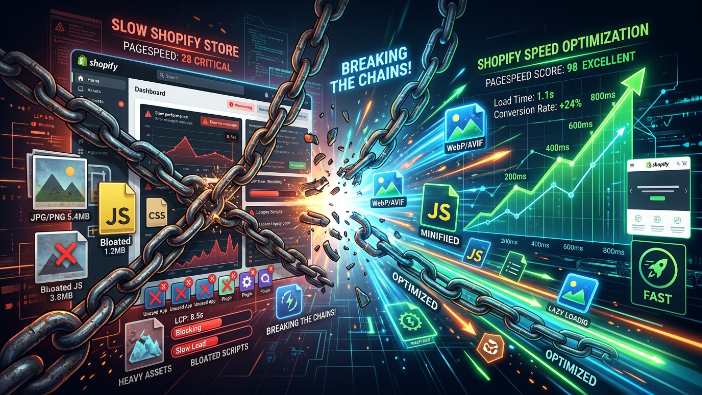
When we ran the initial audit, here is what we found. The homepage was making 143 separate network requests just to load. The total page weight was 8.4 megabytes. There were 23 JavaScript files loading on the homepage, 14 of which were render-blocking. The store had 17 active apps, and every single one of them was injecting scripts that loaded immediately on every page regardless of whether the visitor would ever use that feature.
The largest contentful paint was 5.8 seconds on mobile with a simulated 4G connection, which is exactly the kind of connection most mobile shoppers use. The interaction to next paint was 680 milliseconds, more than three times Google’s threshold. The cumulative layout shift score was 0.34, well above the acceptable limit of 0.1.
Google Search Console showed that zero pages on the site had passing Core Web Vitals according to real user data. The site was marked as having poor page experience across the board.
This is not an unusual starting point. In fact, based on what we see across hundreds of Shopify stores, this store was actually slightly better than average. There are plenty of stores out there in far worse shape.
Phase One: The Complete Audit
Before changing anything, we needed to understand exactly what was causing the problems. Jumping straight into fixes without a thorough audit is one of the most common mistakes in performance optimization. You end up spending time on things that do not move the needle while missing the actual bottlenecks.
We used a combination of tools for the audit. Google PageSpeed Insights gave us the high level scores and flagged the biggest issues. Chrome DevTools gave us a detailed waterfall view of every single request the page was making, in what order, and how long each one took. WebPageTest gave us a filmstrip view of exactly how the page loaded frame by frame so we could see visually where the problems were showing up.
The audit produced a prioritized list of issues. Not everything on the list was equally important. In performance optimization, there is almost always a small number of issues that are causing the majority of the problems. Fix those first and you get the biggest gains with the least effort.
For this store, the top issues in order of impact were as follows.
The hero image on the homepage was a 4.2 megabyte JPG file displayed at 1400 pixels wide. This single image was the primary driver of the poor LCP score. The browser was downloading four megabytes of image data before it could show the most important element on the page.
Fourteen JavaScript files were loading synchronously, blocking the entire page from rendering while each one downloaded and executed. Several of these were app scripts that had no reason to load before the page was visible to the user.
Seven third party tracking scripts were loading in the document head, meaning the browser had to reach out to seven different external servers before it could continue building the page. On a slow day, any one of those servers could add 500 to 800 milliseconds to the load time.
The theme was loading full CSS for eight layout variants the store was not using, adding about 340 kilobytes of unnecessary stylesheet data.
Google Fonts were loading in a way that caused a flash of invisible text on every page, contributing to both poor user experience and layout shift.
Four apps were installed and running scripts but had not been used in months. They were ghost apps, taking up performance budget for zero business value.
Phase Two: Quick Wins That Made an Immediate Difference
With the audit complete, we started with the changes that were easiest to implement and had the highest impact. In performance work these are called quick wins, and they are important not just for the results they produce but for the momentum they create.
The first quick win was removing the four unused apps. This took about twenty minutes and immediately eliminated four JavaScript files from every page load. It also reduced the number of network requests and removed two render blocking scripts. The improvement was measurable immediately. The PageSpeed score moved from 24 to 31 just from this one step.
The second quick win was compressing and converting the hero image. The 4.2 megabyte JPG was converted to WebP format and resized to serve appropriately sized versions for different screen sizes. The desktop version came in at 210 kilobytes. The mobile version, which only needed to be 600 pixels wide, came in at 68 kilobytes. That is a reduction of more than 98% in file size for the element that was causing the most damage to the LCP score.
The third quick win was moving the remaining app scripts from loading in the document head to loading at the end of the document body. This is a simple change that prevents those scripts from blocking page rendering. The page content loads and becomes visible while the scripts continue loading in the background. This alone reduced the INP score significantly because the main thread was no longer being blocked.
After these three changes, the load time dropped from 5.8 seconds to 3.9 seconds and the PageSpeed score moved to 44. Still not good enough, but the direction was clear and the momentum was real.
Phase Three: Image Optimization Across the Entire Store
Images were the single largest contributor to page weight across every page on the store. The homepage was the worst offender, but collection pages and product pages had the same problem. Product images were being uploaded at full camera resolution, sometimes 12 megapixels, and Shopify was serving them at whatever size the theme requested without any intelligent optimization.
We implemented a systematic image optimization process for the entire catalog. Every product image was run through a compression pipeline that reduced file sizes by an average of 73% while maintaining visual quality that was indistinguishable to the human eye. All images were converted from JPG and PNG to WebP format.
We also implemented responsive images properly. This means that instead of serving a 1400-pixel-wide image to a visitor on a 375-pixel-wide phone screen, the browser receives a version sized appropriately for their actual screen. Shopify has built in support for this through its image URL parameters, but most stores do not take advantage of it correctly.
Lazy loading was implemented properly for all images below the fold. The hero image, which is the one that affects LCP, was explicitly marked as high priority so it loaded as fast as possible. Everything else waited until the visitor scrolled toward it.
The result of the full image optimization pass was that average page weight on product pages dropped from 6.1 megabytes to 1.2 megabytes. On collection pages it dropped from 4.8 megabytes to 890 kilobytes. These are dramatic reductions that had an immediate impact on load time.
Phase Four: JavaScript Optimization and Script Management
This is the most technically complex part of the optimization process, but it is also where some of the biggest gains come from. JavaScript is the number one performance bottleneck for most modern websites, and Shopify stores are particularly vulnerable because of how apps inject scripts.
We implemented a script loading strategy based on the principle of loading only what is needed for the initial view as early as possible, and deferring everything else until after the page is interactive.
The scripts were divided into three categories. Critical scripts were things that were genuinely needed before the page could be used. This included the Shopify cart functionality and the core theme JavaScript. These loaded first with high priority.
Important but non blocking scripts were things like the product review display and the currency converter. These needed to load before the visitor might use them, but they did not need to block the initial render. These were loaded asynchronously after the critical scripts.
Deferrable scripts were everything else. The live chat widget does not need to load until a few seconds after the page is visible. The loyalty program widget only matters if someone is logged in. The exit intent popup only needs to be ready when someone is about to leave. The upsell modal only fires after someone adds something to the cart. All of these were configured to load with a deliberate delay or triggered only when their specific condition was met.
This script categorization and loading strategy reduced the total JavaScript execution time on the homepage from 4.2 seconds to 0.9 seconds. The INP score dropped from 680 milliseconds to 140 milliseconds, moving from failing to passing.
One technique that made a significant difference was using the Intersection Observer API to load certain scripts only when the element they power becomes visible in the viewport. The review section was a good example. It is usually below the fold on product pages. There is no reason to load the review widget JavaScript until the visitor scrolls down to where the reviews are. By delaying that load until the reviews section enters the viewport, we saved significant time on the initial page load without removing any functionality.
Phase Five: Third Party Script Management
The seven tracking and analytics scripts were a particular challenge. The business needed all of them. Google Analytics, Meta Pixel, TikTok Pixel, Klaviyo, and Google Ads conversion tracking were all essential for measuring and running their marketing campaigns. None of them could simply be removed.
The solution was to manage when and how they loaded rather than whether they loaded.
All seven scripts were consolidated into Google Tag Manager so they could be managed centrally and loaded in a controlled way. GTM itself was moved to load asynchronously so it did not block the page.
Within GTM, triggers were configured carefully. Google Analytics loaded with a slight delay after the page was interactive rather than at the first moment of page load. Meta Pixel and the other advertising pixels loaded only after the page had fully loaded and the visitor had been on the page for at least one second. This delay is invisible to the tracking accuracy because a visitor who immediately bounces within one second is not meaningful data anyway.
For scripts that came from third party servers, we implemented a technique where the scripts were cached and served from a fast content delivery network rather than being fetched from the original third-party server on every visit. This eliminated the variable latency of external servers and made script loading time predictable and fast.
The combined effect of these third-party script optimizations was a reduction of approximately 1.2 seconds from the load time, just from making these necessary scripts load more intelligently.
Phase Six: Font Loading and Layout Stability
The store was using two Google Fonts, a serif font for headings and a sans serif font for body text. They were being loaded in the standard way, which meant the browser discovered the font need only after parsing the CSS, then made a request to Google’s servers, then waited for the response before showing any text.
We fixed this with font preloading. By adding preload hints to the document head, the browser starts fetching the font files at the very beginning of the page load, in parallel with everything else, rather than waiting to discover them later. This eliminated the flash of invisible text completely.
We also self hosted the font files rather than loading them from Google’s servers. This removed one external dependency and made font loading faster and more reliable, especially for visitors in regions where Google’s servers might be slower to respond.
For the layout shift problem, the main culprits were images loading without explicitly declared dimensions, banner announcements that appeared after the page loaded and pushed content down, and a cookie consent banner that loaded late and shifted the entire page.
Each of these was fixed by declaring explicit dimensions for images in the HTML, pre allocating space for the announcement bar even before it loaded, and loading the cookie banner in a way that did not cause layout shifts. The CLS score dropped from 0.34 to 0.04.
Phase Seven: Server and Caching Optimization
Shopify handles the server infrastructure, which means store owners have less control over this layer than they would with a self-hosted platform. But there are still meaningful optimizations available.
The store was not taking advantage of Shopify’s CDN capabilities fully. By ensuring that all static assets, images, scripts, and stylesheets were being served through Shopify’s CDN rather than from the origin server, and by setting appropriate cache headers, we reduced the time to first byte for returning visitors significantly.
For new visitors, we implemented resource hints that told the browser to pre-connect to the domains it would need to reach. When the browser knows it will need to connect to a specific domain, it can establish that connection in the background before it actually needs to fetch anything. This saves the connection setup time, which can be 100 to 300 milliseconds per domain.
We also reviewed the store’s Liquid templates and eliminated unnecessary database queries that were slowing down server-side rendering. Every Shopify storefront involves some server side processing before the HTML is sent to the browser, and inefficient Liquid code can add significant time to this process.
The Results: Eight Weeks Later
- After all phases of optimization were complete, we ran a comprehensive set of measurements to document the results.
- The mobile PageSpeed score went from 24 to 91. The desktop score went from 47 to 96.
- Largest Contentful Paint on mobile went from 5.8 seconds to 1.4 seconds. This moved from failing to passing with a comfortable margin.
- Interaction to Next Paint went from 680 milliseconds to 140 milliseconds. This moved from failing to passing.
- Cumulative Layout Shift went from 0.34 to 0.04. This moved from failing to passing.
- Total page weight on the homepage went from 8.4 megabytes to 1.1 megabytes.
- Total network requests on the homepage went from 143 to 61.
- JavaScript execution time went from 4.2 seconds to 0.9 seconds.
- These are the technical metrics. But the business metrics are what really matter.
- Bounce rate on mobile dropped from 67% to 48%, a 28% improvement. This meant thousands more visitors per month were actually engaging with the store rather than leaving immediately.
- Average session duration increased from 1 minute 42 seconds to 2 minutes 31 seconds. Visitors were spending nearly a minute longer on the store on average, exploring more products and building more purchase intent.
- Conversion rate on mobile improved from 1.7% to 2.03%, a 19% increase. For a store doing their volume of traffic, this translated directly into tens of thousands of dollars in additional monthly revenue.
- Organic search traffic increased by 41% over the two months following the optimization. This was a combination of improved Core Web Vitals boosting rankings and lower bounce rates sending positive engagement signals to Google.
- The store owner described it as the highest return on investment of anything they had done in two years of running the business.
What You Can Learn From This Case Study
The specific numbers will vary for your store, but the principles are universal. Here is what this case study demonstrates that you can apply directly to your own Shopify store.
Performance debt accumulates silently. This store did not become slow overnight. It happened gradually as apps were added, images were uploaded without optimization, and scripts accumulated. By the time the problem was obvious, it had been costing the business for months. Regular performance audits should be part of running a Shopify store, not a one time project.
The biggest gains come from a small number of changes. In this case, image optimization and script management together accounted for about 75% of the total improvement. If you can only do a few things, focus on your images and how your JavaScript loads. Everything else is marginal by comparison.
You do not have to sacrifice functionality for speed. The store kept all 13 of the remaining apps. All the tracking pixels kept running. The live chat still worked. The upsells still fired. The reviews still displayed. Speed optimization is not about removing features. It is about loading features intelligently.
Mobile is where it matters most. The desktop scores for this store were already mediocre before optimization, but the mobile scores were catastrophic. Most ecommerce traffic is mobile traffic. If you are only testing your store on a desktop computer connected to fast WiFi, you have no idea what your actual customers are experiencing.
The SEO impact takes time but it is real. The conversion rate improvements appeared within days of the optimization being complete. The organic traffic improvement took about six weeks to become clearly visible in the data. Google needs time to recrawl your pages and reassess your Core Web Vitals based on real user data. Do not expect overnight ranking improvements, but they do come.
How to Apply This to Your Store Starting Today
You do not need to hire an agency or spend weeks on optimization to start making progress. Here is a practical sequence for any Shopify store owner.
Start by measuring. Go to PageSpeed Insights and test your homepage, your best collection page, and your top product page. Write down the scores. Check Google Search Console for the Core Web Vitals report. You need to know where you stand before you can know what to fix.
Audit your apps. Log into your Shopify admin and look at every app you have installed. For each one, ask whether you actively use it and whether it is producing measurable business value. Delete anything that does not pass that test. Aim to cut your app count by at least 25%.
Fix your images. This is the single highest impact change most store owners can make on their own. Go through your hero images, collection banner images, and top product images. Check their file sizes. Anything over 200 kilobytes should be compressed. Use a tool like Squoosh to compress and convert to WebP format. Re upload the optimized versions.
Check your theme. Look at your theme’s performance settings if it has them. Disable any features you are not using. Consider whether your theme was chosen primarily for design rather than performance. If your theme is particularly heavy, migrating to a performance-focused alternative like Dawn, Shopify’s free and highly optimized base theme, might be worth considering.
Move non-essential scripts to load later. If you have technical resources available, audit the scripts loading in your theme’s head section and move anything that is not critical for the initial page render to load at the end of the body or with async and defer attributes.
For store owners who want to take optimization as far as this case study shows, working with a specialized Shopify performance service is the most efficient path. The combination of deep technical expertise and Shopify-specific tooling produces results that would take months to replicate manually.
The Competitive Advantage of a Fast Store
Here is the broader point that this case study illustrates. In a world where most Shopify stores are slow, being fast is a genuine competitive advantage.
When two stores sell similar products at similar prices, the faster store wins. Not always in a way you can point to directly, but consistently over time and across thousands of visitor interactions. The faster store ranks higher in Google. The faster store has lower bounce rates. The faster store converts at a higher rate. The faster store retains customers better because the experience feels smooth and professional.
Speed is not a technical vanity metric. It is a business metric. It correlates directly with revenue in ways that have been measured and documented across thousands of stores and hundreds of millions of shopping sessions.
The 1.5 second threshold used in the title of this case study is not arbitrary. It is the point at which a Shopify store’s performance stops being a liability and starts being an asset. Below 1.5 seconds on mobile, you are in the territory where Core Web Vitals pass comfortably, where bounce rates drop meaningfully, and where the store experience feels genuinely fast to real customers on real devices.
Getting there requires systematic work. It requires understanding what is actually slowing your store down, prioritizing the changes that will have the biggest impact, and implementing those changes correctly. But as this case study shows, it is entirely achievable, even for a store that started with a score of 24 and a 5.8 second load time.
The question is not whether your store can get there. The question is how much revenue you are willing to leave on the table while it remains slow.