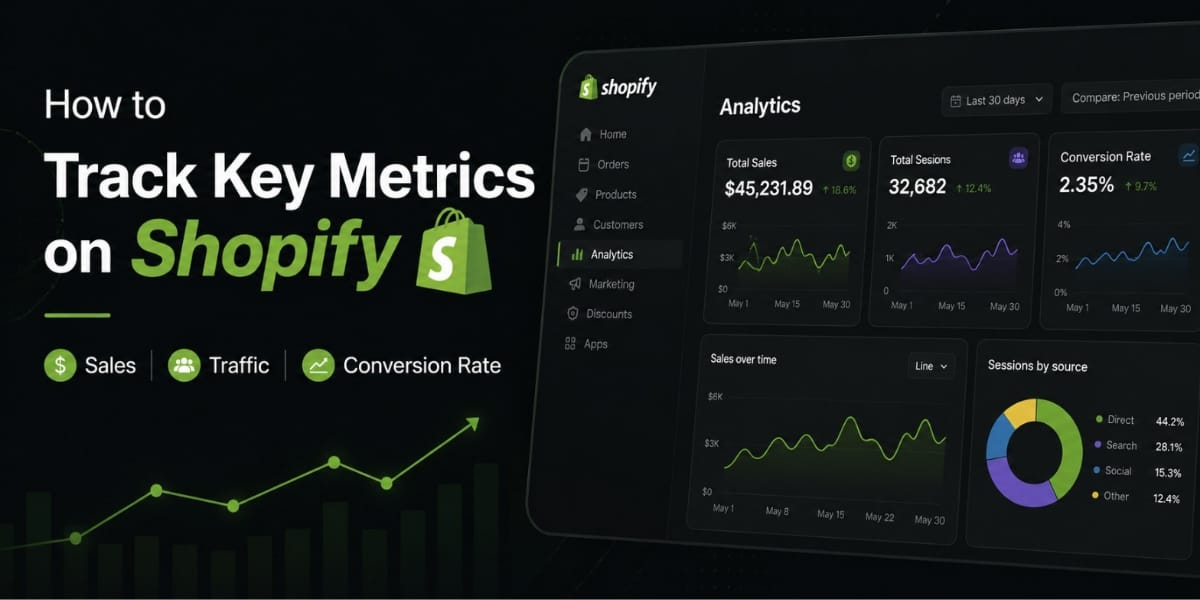
How to Track Key Metrics on Shopify (Sales, Traffic, Conversion Rate)
Let me be straight with you most Shopify store owners check their sales number every morning and call it “analytics.” They look at the total revenue, feel good if it’s up, feel bad if it’s down, and have absolutely no idea why either is happening.
That’s not tracking metrics. That’s just watching numbers.
Real metric tracking means knowing your conversion rate by traffic source. It means understanding whether your traffic is growing or just getting more expensive. It means catching problems in your funnel before they cost you a week of sales.
In this post, I’m going to walk you through exactly how to track the metrics that actually matter on Shopify sales, traffic, conversion rate, and several others you probably aren’t watching closely enough. I’ll show you where to find them, how to read them, and most importantly, what to do when something looks off.
Let’s get into it.
Why Tracking the Right Metrics Changes Everything
Before we get into the how, let me give you the why.
E-commerce metrics are quantifiable measurements that track your online store’s performance across sales, marketing, operations, and customer behavior. They transform raw data into actionable insights.
But here’s the thing most people get wrong. Not all metrics are created equal. The difference between a metric and a Key Performance Indicator matters. Metrics track any measurable business activity like pageviews, bounce rate, or time on page. KPIs are metrics directly tied to business objectives that warrant immediate action. For example, “website traffic” is a metric. “Revenue per visitor from paid search campaigns” is a KPI that tells you whether your ad spend is actually profitable.
The stores that grow consistently aren’t the ones with the most data. They’re the ones that focus on a small set of the right numbers and actually act on what those numbers tell them.
How to Access Your Metrics in Shopify
Let’s start from the basics.
In Shopify, sessions, orders, and conversion metrics are built directly into the Analytics and Reports sections of the admin. Go to Analytics, then Overview Dashboard to see key performance metrics like sessions, orders, and your online store conversion rate.
Here is what each dashboard area is best for. The Overview Dashboard gives you at a glance business health total sales, sessions, conversion rate, AOV, and returning customer rate. Use this daily for a quick pulse check and to spot anomalies. Sales Reports show revenue by product, sales channel, staff, and location use these weekly to identify your best selling products and highest revenue channels. Customer Reports cover first time vs. returning customers, cohort analysis, and lifetime value tracking. Acquisition Reports show traffic source breakdown with sessions, conversion rate, and revenue by channel including organic, direct, social, email, and paid essential for understanding which marketing channels actually drive purchases, not just clicks.
That’s your home base. Now let’s go through each major metric one by one.
1. Sales Your Most Watched Number (and Why You’re Watching It Wrong)
Total sales is the number everyone checks first. And there’s nothing wrong with that it’s important. But on its own, it tells you almost nothing useful.
You need to look at sales broken down by:
Sales by product which items are actually driving your revenue, and which ones are just taking up space in your store and your marketing budget.
Sales by channel if you’re selling on multiple platforms, which one is performing? Which one has the best margin?
Sales by date range is your revenue trending up week over week? Month over month? How does this November compare to last November?
The sales report in Shopify gives you all of this. Go to Analytics, then Reports, then Sales. You can filter by date range, channel, product, and more.
One thing to keep in mind your traffic data is calculated within a minute, but unwanted bot traffic can initially be included in data. Tests to determine bot traffic are run and can take up to 48 hours to complete. If these tests find unwanted traffic, the data is removed from your reports. So don’t panic if numbers shift slightly after the first day.
2. Traffic Where Your Visitors Are Actually Coming From
Traffic is not just a vanity number. It’s a signal. The question isn’t just how many people are visiting your store it’s who they are and how they found you.
The most common traffic sources are search, direct, social, and email. The traffic source cannot always be determined, so an unknown traffic source is also common.
Here’s why this matters. Different traffic sources will naturally convert differently. Visitors who find your store when searching a keyword with high purchase intent tend to convert at a higher rate than those from social media. Why? These visitors are already seeking out a specific answer as opposed to just browsing their feed.
So if your social media traffic is massive but your sales are low, that’s telling you something specific social is driving awareness, not buyers. If your email traffic is small but converts really well, you need to invest more in growing your email list.
How to track your traffic sources in Shopify:
Go to Analytics, then Reports, then Acquisition. You’ll see a breakdown of where your sessions are coming from and this is the important part the conversion rate from each source.
That last bit is everything. Don’t just look at which channel sends the most traffic. Look at which channel sends the most buyers.
Mobile vs. Desktop Traffic
This is another traffic split you need to pay attention to. Mobile devices account for approximately 79% of total traffic to Shopify stores, emphasizing the critical need for mobile optimization in e-commerce strategies.
If nearly 80% of your visitors are on mobile but your mobile conversion rate is significantly lower than desktop, you have a mobile experience problem. Check your store on a phone. Is it fast? Is the checkout easy? Are buttons easy to tap? Is text readable without zooming?
This metric showing sessions by device type is one Shopify makes available directly on the analytics page. Check it regularly.
Sessions by Location
Shopify shows the number of sessions on your online store sorted by country. Through this data, you can tweak your marketing campaigns for more conversions.
For Pakistani merchants this is particularly useful. If you’re seeing traffic from the UAE, UK, or US alongside local traffic, you can segment your marketing messages accordingly. Local buyers respond differently to Pakistani brands than international buyers do.
3. Conversion Rate The Metric That Changes Everything
Of all the metrics in your Shopify dashboard, conversion rate is the one that deserves the most attention. Here’s why.
Assuming you continue to get the same or more traffic, if your store can convert at least 2% of website visitors into buyers instead of only 1%, your revenue doubles.
Same traffic, double the revenue. That’s the power of improving conversion rate.
How to Calculate Conversion Rate
The formula is simple. Conversion rate equals total conversions divided by total visitors, multiplied by 100. For example, if you had 1,000 visitors on your website and 20 of them made a purchase, your conversion rate would be 20 divided by 1,000 multiplied by 100, which equals 2%.
Remember to be consistent with the time frame you’re analyzing. If you’re calculating the conversion rate for a particular month, ensure both the number of visitors and conversions are for that same month.
What’s a Good Conversion Rate?
The average conversion rate for Shopify stores worldwide is around 1.4%. The top 10% of Shopify stores achieve an average conversion rate of 4.7%.
The average Shopify conversion rate is 2.5-3%. Stores converting above 3% are in the top tier, while 4-5% and above indicates excellent optimization. However, benchmarks vary dramatically by industry luxury stores may perform well at 1.5% while food and beverage stores should target 4% and above.
Don’t obsess over hitting a specific number. What matters is that your conversion rate is trending upward over time. An improvement from 1.2% to 1.8% is a 50% increase in revenue with the same traffic that’s massive.
Where to Find Conversion Rate in Shopify
Your conversion rate appears right on your Overview Dashboard. But for more detail, go to Analytics, then Overview Dashboard to see key performance metrics including your online store conversion rate. You can also pair Shopify’s order data with GA4’s session and acquisition insights for a fuller view of your website conversion.
Tracking Micro Conversions Too
Here’s something most merchants skip tracking the smaller steps that lead to a purchase.
The metric most ecommerce teams track is what percentage of traffic buys. But you should also track micro conversions. These are the steps that signal purchase intent, such as adding a product to cart, reaching checkout, or signing up for a newsletter. These are leading indicators.
The add to cart rate refers to the number and percentage of sessions in which shoppers added one or more items to their shopping carts. Littledata found the average add to cart rate was around 5.1%.
The reached checkout rate refers to the number and percentage of sessions in which shoppers added one or more items to their cart, proceeded to checkout, and performed an action.
If your add to cart rate is strong but your checkout completion is low, you have a specific problem at checkout not a general store problem. These micro metrics let you pinpoint exactly where you’re losing customers.
4. Average Order Value (AOV) The Easiest Revenue Lever You Have
Littledata surveyed 2,794 stores and found the average order value was $101. AOV is a key metric that answers questions like: How much do customers spend each time they buy? Are bundles, upsells, and tiered discounts working?
Increasing AOV is often easier than increasing traffic or conversion rate. If you can get customers to spend 20% more per order, you’ve effectively given yourself a 20% raise on existing traffic.
That framing is important. Growing traffic is expensive. Improving conversion rate takes time and testing. But increasing AOV can happen quickly with the right tactics product bundles, free shipping thresholds, upsell offers, or volume discounts.
For free shipping thresholds, set the minimum 20 30% above your current AOV. If your average order is Rs. 2,500, set your free shipping threshold at Rs. 3,000 3,200. You’ll be surprised how many customers add something extra to their cart just to qualify.
5. Returning Customer Rate The Health Check Nobody Does
Returning customer rate is a metric that measures the percentage of customers who make a second purchase from your store. It’s calculated by dividing the number of repeat customers by the total number of customers. A high returning customer rate indicates that a retailer is doing a good job of retaining customers and providing them with a positive shopping experience.
This metric is the health check of your brand. If you have strong sales but a poor returning customer rate, you’re running a leaky bucket business constantly spending money to acquire new customers because the old ones aren’t coming back.
A healthy retention profile shows 15 to 20% of customers from each monthly cohort making a second purchase within 90 days, and 5 to 10% making a third purchase within 6 months.
To find this in Shopify, go to Analytics, then Customers, then Customer Cohort Analysis. You’ll see a grid that shows you exactly how each batch of customers is behaving over time.
6. Sessions Per User Are People Coming Back to Browse?
Littledata surveyed 5,000+ Shopify stores and found average sessions per user to be around 1.4. This means most stores see a high bounce rate as well.
Most visitors don’t buy on the first visit, especially for anything over a certain price point. If your sessions per user is close to 1, it means visitors are coming once and either buying or leaving forever. A higher number means people are returning to browse before committing which is actually a good sign for higher-ticket products.
7. Cart Abandonment Rate The Revenue Sitting in Limbo
This one deserves its own section because the numbers are staggering.
Common causes of cart abandonment include hidden costs at checkout which account for 48% of abandonment per Baymard Institute, mandatory account creation at 26%, complicated checkout at 22%, lack of trust signals, slow site speed, poor product pages, and misaligned traffic.
Look at your reached checkout rate versus your actual purchase rate. The difference is your abandonment problem. If a lot of customers are reaching checkout but not completing, the issue is almost always one of these: unexpected shipping fees, mandatory account creation, a checkout that’s too long, or missing payment methods.
For Pakistani merchants specifically make sure you have popular local payment options available. Many customers abandon when they don’t see a payment method they trust.
How to Improve What You’re Tracking Site Speed Matters More Than You Think
One thing that directly impacts almost every metric on this list especially conversion rate is your store speed.
The findings are unambiguous: speed and sales are directly correlated. For every 32 milliseconds slower a store responds to interactions, conversion tends to drop by about 1.5%.
A single uncompressed three megabyte hero image can drag down Largest Contentful Paint the exact metric Google uses to evaluate load speed. Resize images to the maximum display dimensions needed and use compressed formats. Audit your apps ruthlessly. Every installed app can inject JavaScript into your storefront. Even apps you’re not actively using may still load scripts.
Go to your Shopify admin, then Online Store, then Themes, then check the Speed score on your theme. If it’s below 50, that’s affecting your conversions directly. If it’s below 30, it’s a serious problem.
Setting Up Google Analytics 4 Alongside Shopify
Shopify’s built-in analytics are solid for sales and revenue data, but they have blind spots.
Shopify Analytics has important limitations it does not track on site behavior in detail such as scroll depth, heatmaps, or click patterns. It cannot attribute conversions across multiple sessions by default, and it has limited custom segmentation capability. This is where Google Analytics 4 becomes essential.
You can use tools like Google Analytics to track your site traffic. Include all visitors regardless of whether they made a purchase or not, and remember that visitors should be determined by number of overall sessions, not users.
In GA4, track your funnel conversion rates using the Funnel Exploration report under Explore. Set up a custom funnel with the steps: session start, view item, add to cart, begin checkout, and purchase. This gives you drop off rates at each step, segmentable by traffic source, device type, and new versus returning visitors.
This level of detail is simply not available in Shopify’s native reporting. GA4 tells you the “why” behind the numbers Shopify tells you the “what.”
Only 37% of Shopify merchants have Google Analytics configured correctly with ecommerce events properly tracked and connected to their ad platforms. This means the majority are making marketing decisions based on incomplete data.
Don’t be in that majority. Set it up properly, connect it through the Google and YouTube app in the Shopify App Store, and make sure purchase events are tracking correctly.
A Simple Weekly Tracking Routine
Here’s the exact routine I’d suggest for staying on top of your metrics without spending your whole day in dashboards.
Every morning (5 minutes):
Check your overview dashboard. Look at yesterday’s sales, sessions, and conversion rate. Compare to the same day last week. If anything is dramatically different up or down make a note to investigate.
Every Monday (20 to 30 minutes):
Pull your acquisition report. Which channels drove the most sessions last week? Which ones converted best? Did any channel drop off significantly? Review your top products. Any new winners emerging? Any previously strong products declining?
First of every month (1 hour):
Review your returning customer rate and cohort data. Is retention improving? Check your AOV trend is it moving up or down? Look at your mobile vs. desktop conversion split. If mobile is still significantly lower, what are you doing about it?
Every quarter:
Compare the same metrics year over year. Quarterly seasonality affects every ecommerce business. The only fair comparison is the same quarter last year, not last month.
The Metrics You Can Ignore (At Least for Now)
I want to save you from the trap of tracking too many things. Here are numbers that look important but usually aren’t worth obsessing over early on:
Bounce rate not very meaningful for ecommerce because a lot of visitors leave from the first page and that’s fine.
Pages per session sounds good in theory but a customer who finds what they need on one page and buys it is better than someone browsing five pages and leaving.
Time on site again, a customer who buys in 3 minutes is better than one who spends 20 minutes and doesn’t convert.
Focus on the metrics tied to revenue. Everything else is interesting but not urgent.
Final Thoughts
Here’s the simple version of everything we’ve covered. There are four numbers that matter most for most Shopify stores:
How much traffic are you getting, and where is it coming from? That’s your acquisition picture.
What percentage of that traffic is buying? That’s your conversion rate.
How much is each buyer spending? That’s your AOV.
Are buyers coming back? That’s your retention health.
Everything else supports or explains those four things. Get those four under control with a consistent tracking habit, and you’ll have more clarity about your store than 90% of other Shopify merchants.
It’s not about finding the weakest number and trying to make it average. It’s about finding the biggest opportunity in your funnel and targeting that as your lever for growth.
Start there. The data will tell you exactly where to focus next.