How to Use Heatmaps to Improve Shopify Conversions
Let me ask you something honestly. Do you actually know what your visitors do on your store? Not what you think they do. Not what Google Analytics tells you in boring numbers. I mean really watch where their eyes go, where their mouse hovers, where they get stuck, and where they just give up and leave.
Most store owners don’t know this. They guess. They redesign a page because it “feels right” or because some blog told them white buttons convert better than green ones. That’s not strategy, that’s gambling with your store’s money.
Heatmaps fix this problem. They show you exactly what’s happening on your Shopify store, visually, in colors that make sense even if you’re not a data person. Today let’s talk about heatmaps properly, how they work, how to actually use them to boost your conversions, and how this applies specifically if you’re running a store here in Pakistan.
What Exactly Is a Heatmap
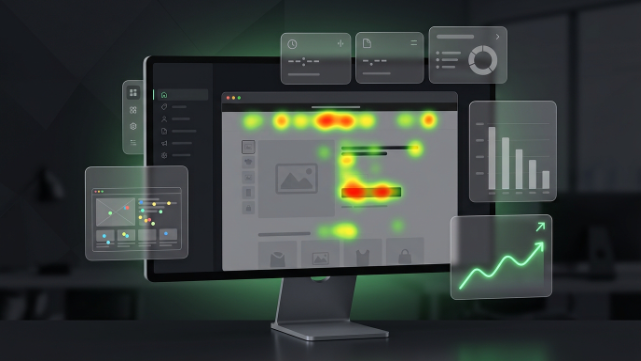
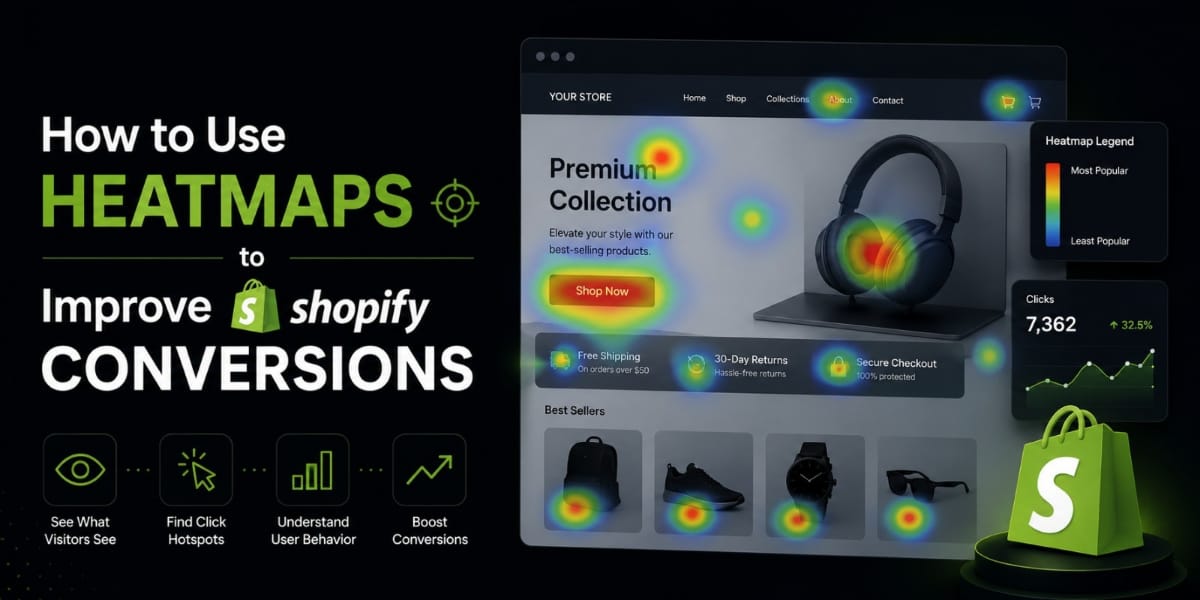
Think of a heatmap as a visual x ray of your webpage. Instead of numbers and spreadsheets, you get colors overlaid on your actual product page or homepage. Red and orange areas show where people click, scroll, or spend the most attention. Blue and cool colors show areas that get ignored.
It’s the difference between someone telling you “customers didn’t like the page” and someone showing you exactly where they stopped scrolling, which button they never touched, and which part of your page they clicked on even though it wasn’t clickable.
That last one happens more than you’d think. People click on things expecting them to be links or buttons, and when nothing happens, they get confused and leave. A heatmap catches that instantly.
The Different Types of Heatmaps You Should Know
Not all heatmaps are the same. There are four main types, and each one tells you something different about your store.
Click maps show you where people are clicking on your page. This is huge for Shopify stores because it tells you if people are trying to click on your product images expecting a zoom, or clicking on text that looks like a link but isn’t.
Scroll maps show you how far down the page people actually scroll before leaving. If you’ve put your best product benefits or your trust badges way at the bottom of the page, and your scroll map shows most people never make it past the first third of the page, you’ve just found a huge conversion leak.
Move maps track mouse movement. This one’s interesting because research shows mouse movement often follows eye movement pretty closely, especially on desktop. So it gives you a rough idea of what people are actually looking at, not just clicking.
Attention maps combine data over time to show which sections hold visitor focus the longest. This is great for figuring out if your product description is actually being read or if people are skipping straight past it.
Why Heatmaps Matter So Much for Shopify Stores Specifically
Here’s the thing about Shopify stores. You’re not running a blog where people read content casually. Every single page on your store exists to move someone one step closer to checkout. Your homepage should push them to collections. Your collection pages should push them to product pages. Your product pages should push them to the cart. And your cart should push them to checkout.
If even one of these steps has a leak, you lose sales. And the frustrating part is you usually don’t know where the leak is unless you can see it.
Heatmaps let you diagnose these leaks page by page. Maybe your add to cart button isn’t getting clicked because it’s below the fold on mobile. Maybe people are ignoring your product images and going straight to reviews, which tells you reviews matter more to your buyers than you realized. Maybe your navigation menu is getting more clicks than your actual products, which means people are confused about where to go next.
Without a heatmap, you’re just guessing at all of this.
Setting Up Heatmaps on Your Shopify Store
Getting a heatmap tool running on Shopify is honestly pretty simple these days. Most heatmap apps in the Shopify App Store install with a script tag or a small snippet you add to your theme, and within minutes you start collecting data.
Popular options people use include Hotjar, Lucky Orange, Microsoft Clarity, and Crazy Egg. Microsoft Clarity is worth mentioning because it’s completely free and still gives you click maps, scroll maps, and even session recordings, which pairs beautifully with heatmap data.
Once it’s installed, don’t expect magic in the first hour. You need real traffic flowing through your store before the data means anything. A heatmap based on ten visitors tells you nothing. You want at least a few hundred sessions on a specific page before you start drawing conclusions, and for your most important pages like your best selling product, you’ll want even more.
Reading Your Homepage Heatmap
Your homepage is usually the first impression, so let’s start there. When you pull up your homepage heatmap, look at three things.
First, check if people are clicking your main banner or hero image. If your hero has a call to action button and the heatmap shows barely any clicks there, your banner isn’t doing its job. Maybe the message isn’t clear, maybe the button doesn’t look clickable, or maybe people just don’t care about what you’re promoting.
Second, look at your scroll map. If most visitors don’t scroll past the first screen, everything below that point is basically invisible. This means your best selling products, your trust signals, your promotions, none of it is being seen by most visitors. You need to either move important content higher up or make people want to scroll further.
Third, check what people click that isn’t actually clickable. This happens a lot with images that look like buttons or text that looks bold enough to be a link. Every one of these is a small moment of confusion for your visitor, and confusion kills conversions.
Reading Your Product Page Heatmap
Product pages are where the real money decisions happen, so this is where heatmaps become incredibly valuable.
Look at whether people are engaging with your product images or skipping straight past them. If they’re barely touching your image gallery, you might need better photos, more angles, or a cleaner gallery layout.
Check your add to cart button. Is it getting clicked at the rate you’d expect, or is it sitting there ignored? If it’s ignored, is it because the button isn’t visible enough, or because people aren’t convinced yet and need more information first?
Look at your product description and specs section. If your scroll map shows people jumping straight from the price to the reviews and skipping your description entirely, that tells you something important. Maybe your buyers trust social proof more than your own words, which means you should feature reviews more prominently, higher up on the page.
Also pay attention to size charts, variant selectors, and shipping information. If people are hovering or clicking around these repeatedly without moving forward, that’s hesitation. That’s a sign they need clearer information before they’ll commit.
Reading Your Cart and Checkout Heatmaps
This is the page where lost sales hurt the most because these visitors were so close to buying. If you notice people clicking on shipping cost information over and over, or hovering near the total price for a long time, that often means sticker shock. Maybe your shipping fees are surprising them at this stage rather than earlier.
If people are clicking on coupon code fields but you don’t actually have active promotions, that’s a signal. A lot of shoppers now expect a discount code box, and if they can’t find one or if it doesn’t work smoothly, they might abandon the cart to go search for a coupon elsewhere, and never come back.
Turning Heatmap Data Into Real Changes
Here’s where a lot of store owners stop short. They look at the heatmap, say “oh interesting,” and then do nothing about it. That’s a waste of good data.
Once you spot a pattern, make one change at a time and measure it. If your scroll map shows people never reaching your trust badges, move them higher and check the heatmap again in a couple weeks. If your click map shows people ignoring your call to action button, try a different color, different text, or a different position, then compare.
Small changes based on real behavior data usually beat big redesigns based on guesswork. You’re not trying to reinvent your store every month. You’re trying to remove friction, one point at a time, based on what real visitors are actually doing.
Combining Heatmaps With Session Recordings
If your heatmap tool offers session recordings, use them together. A heatmap tells you what’s happening in aggregate. A session recording shows you one specific person’s actual journey, mouse movements, hesitations, and all.
Sometimes a heatmap will show a weird pattern, like a lot of clicks in an odd spot, and you won’t understand why until you watch three or four actual recordings and realize people are trying to click on a badge that looks like it should open more information but doesn’t. That kind of insight rarely comes from numbers alone. It comes from watching real behavior.
Common Mistakes Store Owners Make With Heatmaps
One big mistake is checking heatmaps once and never again. Visitor behavior changes as your store, your traffic sources, and your products change. A heatmap from six months ago might not reflect how people behave today, especially if you’ve changed your theme or added new sections.
Another mistake is mixing desktop and mobile data together. Behavior on mobile is completely different from desktop. People scroll faster, tap instead of hover, and have much less patience. Always check heatmaps separately for mobile and desktop, since most Shopify stores get the majority of traffic from mobile anyway.
A third mistake is drawing conclusions from too little data. If your product page only gets thirty visits a month, wait longer before making decisions. Small sample sizes can mislead you into changing something that wasn’t actually broken.
Heatmaps and the Pakistani Ecommerce Market
Now let’s bring this closer to home, because running a Shopify store for buyers in Pakistan comes with its own behavior patterns that heatmaps can reveal really clearly.
A huge chunk of your traffic is coming from mobile, often on average or lower end phones with slower internet in many cities outside the big metros. Heatmaps will often show something specific here, people abandoning scroll partway through image heavy pages because loading feels slow. If your scroll map shows a big drop off right where a heavy image or video sits, that’s a loading speed issue, not a content issue.
Cash on delivery is still the dominant payment preference for a large share of Pakistani shoppers, alongside JazzCash and Easypaisa. Watch your checkout heatmap closely for hesitation around the payment method selection step. If you notice a lot of clicking and re-clicking around this area, it often means your COD option isn’t clearly visible, or people are confused about whether online payment is mandatory.
Trust is a bigger hurdle here than in many other markets, simply because online shopping fraud concerns are more common in people’s minds. Heatmaps often reveal Pakistani visitors hovering longer around trust badges, return policy links, and contact information before deciding to buy. If your scroll map shows people are reaching your reviews or your delivery partner logos like Leopards, TCS, M&P, Trax, or PostEx, but not converting afterward, that tells you the trust signals aren’t strong enough yet and might need to be more prominent or detailed.
Also keep an eye on how people interact with your PKR pricing display. If your store shows prices in multiple currencies and your heatmap shows repeated clicking near the price area, visitors might be confused about actual cost in rupees, especially with additional shipping or COD charges added later at checkout. Clarity here removes a lot of unnecessary hesitation.
Building a Habit Around Heatmap Reviews
The stores that actually improve over time are the ones that treat heatmaps as an ongoing habit, not a one time check. A simple approach that works well is reviewing your top three pages, usually your homepage, your best selling product page, and your cart page, once every two to three weeks. Look for new patterns, especially after any theme change, new collection launch, or marketing campaign that brings in a different type of visitor.
Keep a simple note of what you changed and when, so you can actually track whether that change moved the needle. Conversion optimization isn’t a one time project, it’s a habit you build into how you run the store.
Wrapping This Up
Heatmaps take the guesswork out of running your Shopify store. Instead of assuming what your customers want, you get to actually see it, click by click, scroll by scroll. And once you start reading that data properly, small changes start adding up to real conversion improvements over time.
If setting all this up feels like a lot, or if you’d rather have someone experienced actually read the data and make the right changes for you, that’s exactly the kind of work we do at TheScriptFlow. We help Shopify store owners across Pakistan and internationally set up proper heatmap tracking, understand what their visitors are really doing, and turn that into real, measurable conversion improvements. Reach out to us at thescriptflow.com and let’s take a proper look at your store together.