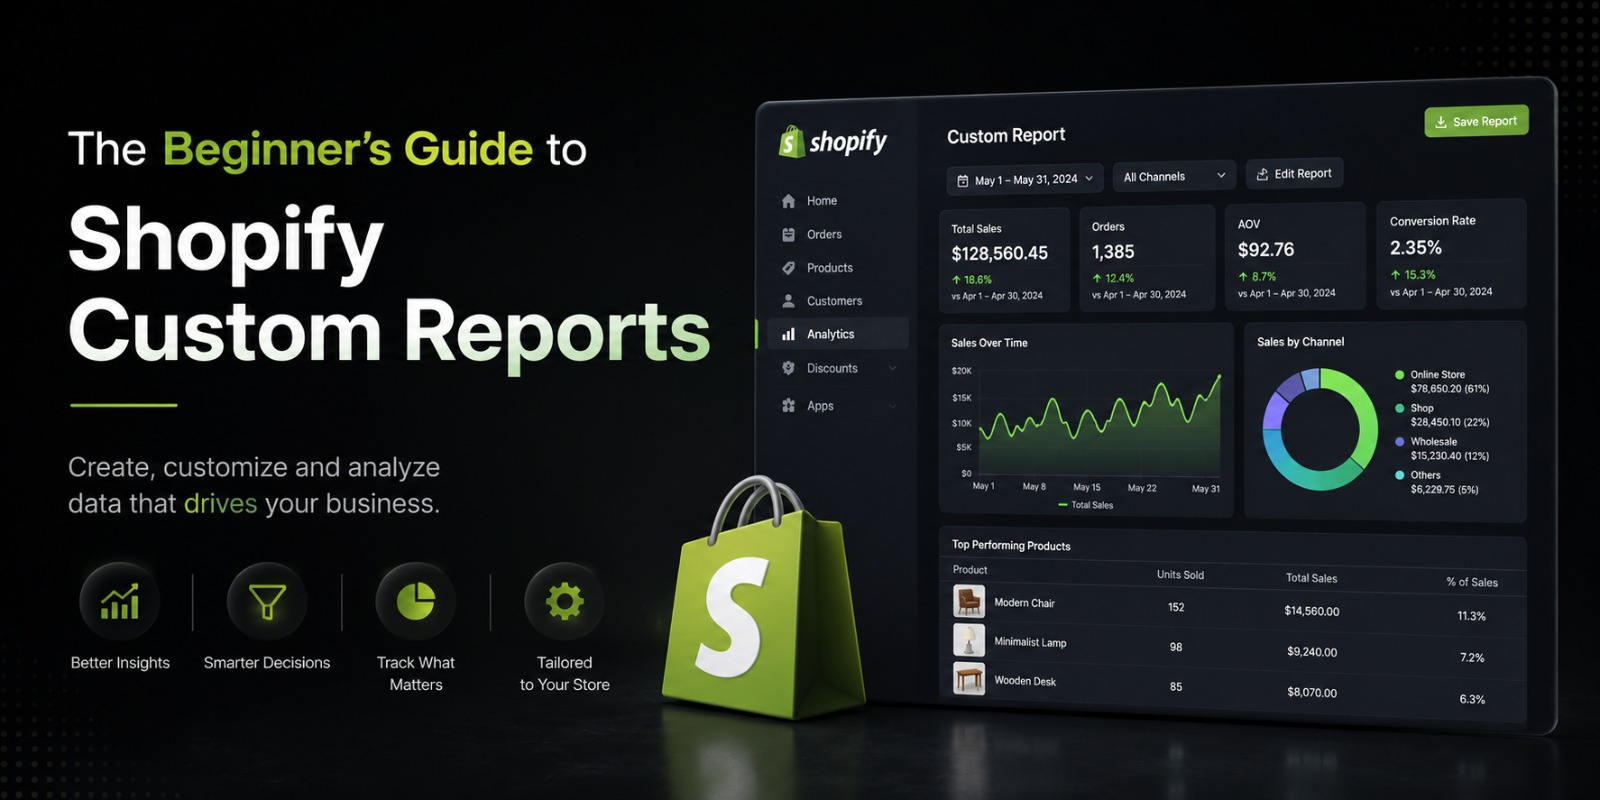
The Beginner’s Guide to Shopify Custom Reports
Everything You Need to Know to Start Making Smarter Business Decisions
If you have been running a Shopify store for a while, you already know that data is everywhere. Sales numbers, traffic stats, customer behavior, inventory levels it is all being tracked in the background every single day. But here is the problem most store owners run into. They look at the default reports Shopify gives them, feel a little lost, and end up making decisions based on gut feeling instead of actual numbers.
That is where custom reports come in.
Shopify custom reports let you go beyond the basics. Instead of looking at generic summaries, you get to build your own views of your data filtering, sorting, and organizing information in a way that actually makes sense for your specific store. Whether you are trying to figure out which products are dragging down your average order value or which customer group is your most loyal, custom reports give you the answers.
This guide is written for beginners. You do not need to be a data analyst or have any technical background to follow along. By the end, you will know exactly what Shopify custom reports are, how to set them up, and how to use them to grow your store.
What Are Shopify Custom Reports
Before jumping into the how, it helps to understand the what.
Shopify comes with a set of built-in reports that cover the basics total sales, sessions, top products, and so on. These are fine when you are just starting out. But as your store grows, you start asking more specific questions. Questions like: which discount code brought in the most revenue last month, or which city in Pakistan is buying the most of a particular product, or how does my average order value change on weekends compared to weekdays?
The default reports cannot answer those questions. Custom reports can.
A custom report is essentially a report that you build yourself. You choose what data gets pulled, how it gets filtered, how it gets grouped, and how it gets sorted. You are in control of the output, which means you get answers to the questions that actually matter to your business not just the questions Shopify decided to answer for you by default.
Who Can Access Custom Reports
This is an important point, especially if you are on a basic plan. Shopify locks custom reports behind its higher tier plans.
Here is how access breaks down:
Shopify Basic does not include custom reports. You get access to the pre built reports, but you cannot create your own or edit existing ones.
Shopify (the standard mid tier plan) gives you access to the reports section, but custom report creation is still limited compared to higher tiers.
Shopify Advanced and Shopify Plus give you full access to custom reports. You can build reports from scratch, edit existing ones, add custom columns, apply filters, and save as many reports as you want.
If you are on a lower plan and want custom reporting capabilities, you have two options. One is to upgrade your plan. The other is to use a third party analytics app from the Shopify App Store, which we will talk about later in this guide.
Why Custom Reports Actually Matter for Your Store
A lot of store owners skip the reporting side of things because it feels complicated or optional. It is neither. Here is why custom reports are actually one of the most useful tools you have access to.
You stop guessing and start knowing. When you build a report that shows you exactly which products are being returned most often, you stop wondering why your profit margins look off. You know. And once you know, you can do something about it.
You save time on decisions. Instead of pulling numbers from three different places and trying to add them up manually, a well-built custom report puts everything in one view. The decision that used to take an afternoon now takes five minutes.
You can spot trends early. If you are tracking the right metrics over time, you will notice when something is changing before it becomes a real problem. A slow dip in repeat purchase rate, for example, might not show up in your overall revenue numbers right away but a custom report tracking that specific metric will catch it early.
You can run your store more profitably. At the end of the day, the purpose of any report is to help you make better decisions that lead to more money coming in or less money going out. Custom reports let you get specific about where your profit is coming from and where it is being lost.
Getting Into the Reports Section on Shopify
If you are on an eligible plan, here is how to find the reports section and start exploring.
Log in to your Shopify admin dashboard. On the left side menu, look for Analytics and click on it. Then click on Reports. This is where all of your reports live both the default ones and any custom ones you create.
You will see reports organized into categories. Finance, sales, customers, acquisition, inventory, and so on. Spend a few minutes clicking through these categories to get a feel for what is already available before you start building custom ones. Sometimes the report you need already exists and just needs a filter applied to it.
At the top right of the Reports page, you will see a button that says Create custom report. That is your starting point for building something from scratch.
How to Create Your First Custom Report
Let us walk through the process of building a simple custom report so you understand how it works in practice.
Step one Choose your report type. When you click Create custom report, Shopify will ask you to choose a base report template. This is the category of data you want to work with. Options include sales by product, sales by customer, sales by traffic source, and several others. Pick the one that is closest to what you are trying to find out. For this example, let us say you pick Sales by product.
Step two Add or remove columns. Once you have chosen a base report, you will see a table with default columns. You can add columns that are not showing by clicking the column selector, and you can remove columns you do not need. For a sales by product report, you might want columns like product title, quantity sold, gross sales, discounts, returns, and net sales. Add whatever is relevant and remove what is not.
Step three Apply filters. This is where custom reports get powerful. You can filter by date range, by product type, by sales channel, by customer tag, by location, and more. Let us say you only want to see data from the last 30 days and only from your online store channel. Apply those filters and the report will only show data that matches.
Step four Group your data. Grouping lets you organize your data into meaningful chunks. For example, you might group your sales data by product type so you can see how apparel is performing compared to accessories. Or you might group by month to see trends over time.
Step five Sort your results. Once your data is filtered and grouped, sort it in a way that makes the most important information jump out. If you want to find your best-selling products, sort by quantity sold in descending order. If you want to find products with the highest net sales, sort by net sales.
Step six Save your report. Give your report a name that describes what it shows. Something clear like Top Products by Net Sales Last 30 Days works well. Click Save and your report will be stored under your custom reports for easy access later.
Most Useful Custom Reports for Shopify Store Owners
Now that you know how to build one, here are some of the most valuable custom reports to set up for your store. These are the ones that actually move the needle.
Sales by Product Monthly Comparison
Build a report that shows your top products by net sales, filtered to the current month, and save a copy with the same filters set to the previous month. Comparing the two gives you a quick read on which products are gaining momentum and which are slowing down. This is one of the most actionable reports you can have.
Customer Purchase Frequency Report
This report shows you how often customers are buying from your store. Set it up to show number of orders per customer over the last 90 days. Once you have this data, you can see how many of your customers are one-time buyers versus repeat buyers. If most of your customers only buy once, that tells you to put more energy into retention strategies like email sequences and loyalty programs.
Discount Code Performance Report
If you run any kind of promotional campaigns which most stores do this report is essential. Filter your sales data by discount code and look at the revenue generated by each code, the number of orders it was applied to, and the total discount amount given away. This helps you understand which promotions are actually profitable and which ones are just giving away money.
Sales by Geography
For Pakistani store owners who also sell to international customers, a geographic breakdown of sales is incredibly useful. You can see which countries or regions are generating the most revenue and make decisions about where to focus your marketing spend. You might discover, for example, that a specific city is buying from you more than you expected, which tells you there is an audience there worth targeting more directly.
Returns and Refunds by Product
A report that shows you which products are being returned most often, and what the return rate is as a percentage of total sales, is one of the most important reports for protecting your margins. If one product has a 25 percent return rate and you have been running ads to push more of it, you have a problem. This report helps you catch things like that before they eat up your profits.
Revenue by Traffic Source
This report pulls sales data grouped by the traffic source that brought in the customer. Organic search, paid social, email, direct, and so on. When you can see which channel is actually driving the most revenue not just the most traffic you can allocate your marketing budget much more intelligently.
Applying Filters Like a Pro
Filters are the most powerful part of custom reports, and they are also the part most beginners underuse. Here are a few filtering tips that will make your reports significantly more useful.
Always set a specific date range. Open-ended reports that pull all historical data can be confusing and slow to load. Set a date range that matches the question you are asking.
Use the sales channel filter to separate your data. If you sell through both your online store and a point of sale setup, mixing those numbers together can skew your analysis. Filter to one channel at a time for cleaner insights.
Filter by product tag to analyze specific product groups. If you tag your products by category, brand, or season, you can use those tags in your filters to get a focused view of just that group.
Use the customer tag filter to segment your audience. If you use customer tags for things like VIP, wholesale, or first-time buyer, you can build reports that only look at those segments. This is how you start doing real customer segmentation without needing an expensive CRM.
Exporting and Sharing Your Reports
Once you have a custom report set up the way you want it, you do not have to stay inside Shopify to use the data. You can export any report to a CSV file, which you can then open in Excel or Google Sheets for further analysis or to share with your team.
To export, open the report and look for the Export button. Click it and choose whether you want to export the current view or all rows. The CSV will download to your computer and you can work with it however you need.
If you work with a team, you can also save reports and share the link so that other admin users can access the same view directly in Shopify without having to rebuild it.
Third-Party Reporting Apps for More Power
If you are on a lower Shopify plan or if you need reporting capabilities that go beyond what native Shopify offers, third-party apps can fill the gap significantly.
Some of the most popular options include:
Reportify, which is designed specifically for Shopify and gives you a much wider range of pre-built and custom report templates. It is a good option if you want advanced reporting without the learning curve of building everything from scratch.
Better Reports is another strong option that lets you build very specific custom reports, schedule them to be sent to your email automatically, and work with data across multiple stores if you have more than one.
Google Analytics and Google Looker Studio are free tools that, when connected to your Shopify store, give you extremely detailed reporting on customer behavior, traffic, and conversion paths. These take a bit more setup but are worth it for any store doing serious volume.
Triple Whale and Northbeam are more advanced tools designed for stores that are running paid advertising and need detailed attribution data. These are more relevant once you are spending significant amounts on ads.
Common Mistakes Beginners Make With Shopify Reports
Now that you know how to set things up, here are a few mistakes to avoid.
Looking at too many reports at once. It is tempting to set up ten different reports and check them all daily. That usually leads to confusion rather than clarity. Pick three to five reports that answer your most important questions and focus on those consistently.
Not comparing over time. A single data point tells you nothing. Revenue this month only becomes meaningful when you compare it to last month or the same month last year. Always build your analysis around comparisons.
Confusing gross sales with net sales. Gross sales include discounts, returns, and taxes that have not been deducted yet. Net sales is what you actually made after those deductions. Always use net sales when you are trying to understand profitability.
Ignoring the customer data. Most store owners spend all their time looking at product and sales reports and almost no time looking at customer reports. Your customer data tells you who is buying, how often, and how much they are spending over time. That information is gold for retention and repeat purchase strategies.
Not saving reports for repeated use. If you find yourself building the same report every month, save it. Name it clearly. It takes two minutes to save and it saves you twenty minutes every time you come back to it.
How TheScriptFlow Helps Shopify Stores With Data and Reporting
At TheScriptFlow, we work with Shopify store owners at every stage from merchants who are just getting started to established brands doing serious volume. One of the things we see consistently is that store owners who make a habit of looking at the right data grow faster than those who do not.
When we build or optimize a Shopify store, we always look at the reporting setup as part of the project. That includes making sure the right data connections are in place, that the analytics tools are properly configured, and that the store owner knows which reports to look at and what to look for.
If you want help setting up your Shopify store for smarter reporting and better decision-making, the team at TheScriptFlow is ready to help. Visit thescriptflow.com to get in touch and talk about what your store needs.
Final Thoughts
Custom reports are not a feature reserved for big brands with full-time analysts. They are a practical tool that any Shopify store owner can start using to make smarter, faster, and more confident business decisions.
You do not need to build twenty different reports or spend hours analyzing data every week. You just need a handful of well-built reports that answer your most important questions — and the habit of actually looking at them.
Start with one. Build a simple sales by product report, filter it to the last 30 days, sort by net sales, and see what you learn. That first report alone might change how you think about your store.
From there, layer in more. Add a customer frequency report. Add a returns report. Add a discount code performance report. Over time, you will build a reporting system that gives you a clear and honest picture of how your business is doing and where it needs to go next.