The Complete Guide to Shopify Analytics (2026 Edition)
Let me ask you something. You’re running your Shopify store, orders are coming in, traffic is hitting the site but do you actually know what’s working and what isn’t? Do you know where your customers are dropping off? Which products are costing you more in ad spend than they’re making you in revenue? Which traffic source is bringing in buyers versus browsers?
If you can’t answer those questions, you’re running your store blind. And that’s exactly what Shopify Analytics is designed to fix.
In this guide, I’m going to walk you through everything what Shopify Analytics is, how to use each section of it, which numbers actually matter, what Shopify can’t tell you, and what tools you should layer on top of it. By the time you finish reading this, you’ll know exactly how to turn your data into decisions.
Let’s get into it.
What is Shopify Analytics?
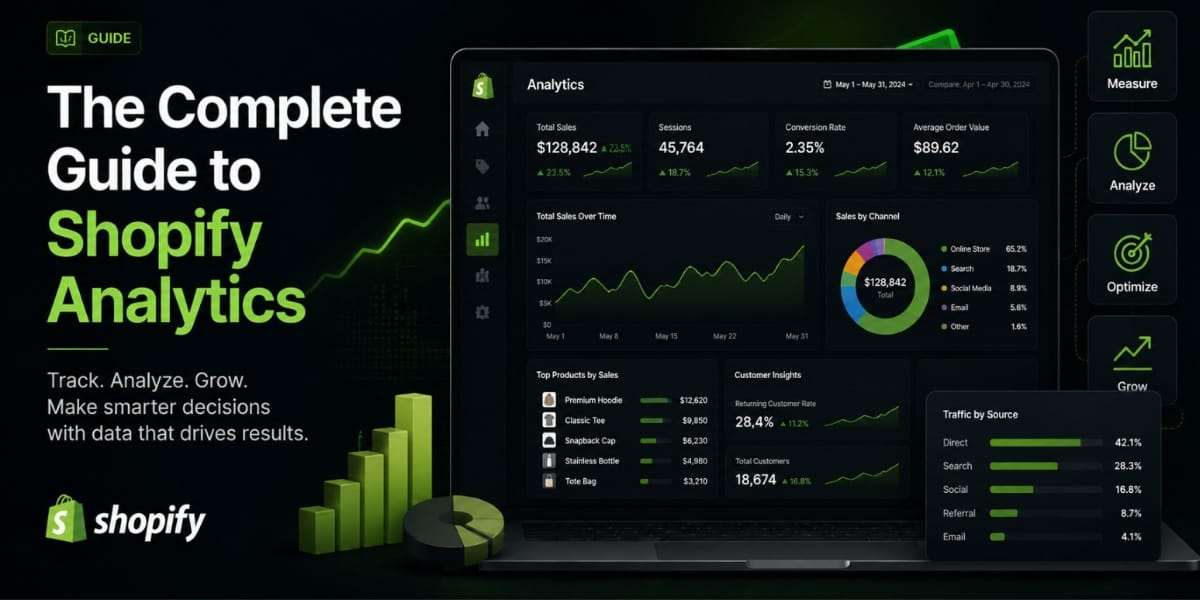
Shopify Analytics is the native reporting platform built into every Shopify store. It tracks your sales, orders, traffic, and customer behavior automatically, presenting everything in an easy to understand dashboard.
The thing I like about it is that it’s built specifically for ecommerce, not general website traffic. This means the metrics actually matter to store owners total sales, conversion rates, average order value, and returning customer rates. You won’t find yourself drowning in pageview counts that don’t translate to revenue.
And here’s the best part Shopify Analytics requires zero configuration. Every store gets analytics from day one with no complicated setup and no developer required.
Shopify makes Analytics available to merchants on any subscription plan, though the depth of reporting varies. Even the most basic plan includes useful reports covering acquisition, behavior, customers, and sales. As you move up to Shopify Advanced or Plus, you unlock custom reporting with ShopifyQL Shopify’s query language and deeper data exploration.
How to Access Your Shopify Analytics
Getting to your analytics is straightforward. From your Shopify admin, click Analytics in the left sidebar. You’ll land on the overview dashboard showing your most important metrics as customizable cards.
Each card displays a key metric with a percentage change from your selected comparison period. Click any card to dive into the full report behind that number.
You can also control the time range you’re looking at. The date range selector lets you analyze any time period fixed ranges for specific campaigns or quarters, rolling ranges that update automatically like last 7 days or last 30 days, and custom time windows down to the minute for monitoring live events.
You can also compare your selected period to previous timeframes. This is useful for answering questions like “How did this Black Friday compare to last year?” or “Are my conversion rates improving month over month?”
The Overview Dashboard Your Daily Pulse Check
The first thing you see when you open Analytics is the Overview Dashboard. Think of this as your store’s daily health report.
The Overview Dashboard functions as your daily pulse check. When you navigate to Analytics, then Dashboard in your Shopify Admin, you see key metric cards with sparkline trend lines and percentage change indicators comparing your selected date range to a prior period.
The key Shopify metrics you’ll see here include Total Sales and Orders showing your store’s total revenue and the number of purchases made, Conversion Rate showing the percentage of visitors who completed a purchase, Average Order Value showing the average amount spent per transaction, and Top Products and Traffic Sources showing your best-selling items and where your visitors are coming from.
One thing worth knowing with the Shopify Editions Winter 2025 updates, the dashboard became significantly more flexible. Merchants can now customize analytics using the metrics and dimensions they choose, with more personalized reporting rolling out across all plans. Shopify also added bundle performance metrics to the new analytics and made the admin 25% faster on initial page load.
The dashboard is where you start your day. You’re not meant to deep-dive here you’re just getting a quick read on what’s going on with your store before you go into specific reports.
Live View Watch Your Store in Real Time
Live View is one of those features that feels a bit addictive once you discover it. It shows you what’s happening in your store right now active visitors, what pages they’re on, what they’re buying.
Live View is most valuable during high traffic moments product launches, flash sales, or Black Friday where you need instant visibility into traffic surges and active cart behavior.
Don’t stare at this all day. It’s genuinely useful during launches and promotions, but for day-to-day decision making, you want the report-based data.
The Key Metrics You Need to Track Weekly
Shopify stores that actively use analytics tracking metrics and running experiments based on data grow 23% faster than stores that rely on intuition alone. Without analytics, you are operating on assumption.
So let me walk you through the numbers that actually matter.
Total Sales
This is your top-line revenue number. Simple enough. But don’t just look at it in isolation always compare it to the same period last week, last month, and last year. A number on its own tells you nothing. A trend tells you everything.
Conversion Rate
This is the percentage of visitors who actually buy something. For most Shopify stores, a healthy conversion rate sits between 1.5% and 3.5%. If you’re below that, something in your funnel is leaking and we’ll talk about the funnel report in a moment.
Average Order Value (AOV)
AOV shows the average amount spent per transaction. This is one of the most powerful levers in your entire store. Increasing AOV by even 10 15% through upsells, bundles, or free shipping thresholds can have a massive impact on revenue without needing a single extra visitor.
Returning Customer Rate
This tells you how many of your customers are coming back to buy again. A high returning customer rate means your products are good and your brand experience is working. A low one means you’re constantly spending money to find new customers instead of keeping the ones you already have.
Cart Abandonment Rate
The average Shopify store has a 70% cart abandonment rate. Reducing this by even 10 percentage points to 63% can increase revenue by 20-25% with no additional traffic.
That’s a massive opportunity sitting right there in your data.
Understanding Shopify’s Report Sections
Shopify organizes its reports into several categories. Let me break down what each one covers and why it matters.
Acquisition Reports
Acquisition reports help you track how customers find your store. In your Shopify Admin, go to Analytics, then Reports, and scroll down to the Acquisition Reports section. You’ll see Traffic Sources showing a breakdown of visitors from organic search, paid ads, social media, and direct traffic, as well as First Time vs. Returning Customers to identify whether you’re attracting new buyers or retaining existing ones.
This is where you figure out what’s actually bringing people to your store. If 80% of your traffic is coming from paid ads, that’s a fragile business. If you’re building organic search traffic, that’s a much more sustainable foundation.
Behavior Reports
Behavior reports show you what people do once they’re on your site which pages they visit, how long they stay, where they exit. This is where you identify friction points in your store experience.
Sales Reports
Beyond sales numbers, these cover payments, taxes, and profit margins. The profit margin report factors in cost of goods sold to show true profitability, not just revenue.
This distinction matters more than most merchants realize. Revenue is vanity. Profit is reality. Make sure you’re looking at margin numbers, not just top line sales figures.
Customer Reports
Customer reports are where you understand who is actually buying from you where they’re located, how much they spend, how often they come back. This data helps you build smarter marketing campaigns and make better product decisions.
The Funnel Report Your Most Valuable Tool
If I had to pick one report in Shopify Analytics that gives you the most actionable information, it would be the funnel report. This is where you see exactly where people are dropping off in your purchase journey.
The funnel report shows you exactly where visitors drop off. That drop-off point is your biggest opportunity.
Here is what healthy conversion rates look like at each stage. From Session Start to Browse, 40 60% should continue past the homepage. From Browse to Product View, 30 50% of browsers should view a product. From Product View to Add to Cart, 8 15% of viewers should add to cart. From Add to Cart to Checkout, 40 55% of carts should go to checkout. And from Checkout to Purchase, 45 55% of checkouts should complete.
Compare your numbers to those benchmarks. The stage where you’re furthest below the benchmark is where you focus first.
If you have strong traffic and high product page engagement but low add to cart rates, your product pages need work better photography, stronger copy, or more compelling social proof. If add to cart rate is high but checkout completion is low, you have a checkout friction problem unexpected shipping costs, too many form fields, or lack of trusted payment methods.
The funnel report turns a vague problem like “my conversion rate is low” into a specific, actionable one like “customers are adding to cart but not checking out.” That’s a completely different problem with a completely different solution.
Product Reports Know What’s Actually Working
The product report segments every product by traffic and add to cart rate. This is where you see which products are actually earning their place in your store and which ones are wasting your marketing budget.
Here’s a way to think about it. Your overall conversion rate is an average. And averages hide the real story. Your store might convert at 2% overall. But Product A converts at 8% with low traffic. Product B converts at 0.5% with high traffic. The average masks both problems.
Use your product reports to find your hidden winners. If a product converts really well but doesn’t get much traffic, send more traffic to it. If a product gets a lot of traffic but barely converts, either fix the page or pull back the spend.
Shopify Analytics by Plan What You Get at Each Level
Not all Shopify plans give you the same level of analytics. Here’s what you’re working with:
On the Basic plan, you get pre-built reports only. No custom reports, no saved views, no scheduled exports. It’s enough to get started but limited.
On the Shopify plan, you get additional filtering options and professional level reports. Profit reports are available here.
On Advanced Shopify, you get custom report builder access and deeper data exploration. This is where analytics starts to feel genuinely powerful.
On Shopify Plus, you get everything including ShopifyQL. ShopifyQL Notebooks enable SQL like querying directly against your Shopify data. The Winter 2025 Editions update made ShopifyQL accessible from within any report view, allowing real time data querying for more dynamic and customizable reporting.
If you’re on Basic or Shopify plan and hitting limitations, consider pairing Shopify’s native analytics with Google Analytics 4, which is free and fills a lot of the gaps.
Where Shopify Analytics Falls Short
I want to be honest with you here Shopify Analytics is good, but it has real limitations you need to know about.
Shopify Analytics has important limitations: it does not track on site behavior in detail such as scroll depth, heatmaps, or click patterns. It cannot attribute conversions across multiple sessions by default, and it has limited custom segmentation capability.
There’s also the data freshness issue. Shopify Analytics uses batch processing that updates every 1 3 hours normally. During high traffic periods like flash sales and Black Friday, delays can stretch to 12-24 hours. You cannot make real-time decisions during your most critical sales moments.
And there’s a revenue tracking limitation too. Shopify doesn’t track net profit, so tools like TrueProfit help monitor cost of goods sold, ad spend, and real profitability.
The bottom line is this Shopify Analytics tells you what happened (sales, orders, sessions), but it doesn’t always tell you why it happened or what people did on your site. For that, you need to layer on additional tools.
Setting Up Google Analytics 4 for Your Shopify Store
Google Analytics 4 is the tool most serious Shopify merchants use alongside Shopify’s native analytics. It fills in the behavioral gaps that Shopify leaves.
Since Google Analytics shares insight into how website visitors behave when they interact with your online store, it helps you answer questions like: What are the most-visited products and pages on your ecommerce site? On average, how much time are people spending on a particular page?
GA4 collects data with an event-based model. Every interaction that a user has on your website is classified as an event whether that’s loading a page, clicking a link, or viewing a video. Each event can have multiple parameters that offer additional context about the interaction.
GA4 divides its data into four reporting categories: acquisition, engagement, monetization, and retention. You can also see real-time reports that show how people are interacting with your website in the present moment.
To connect it to Shopify, the easiest method is the Google and YouTube app from the Shopify App Store. It handles the integration without needing to touch any code.
One important stat worth knowing only 37% of Shopify merchants have Google Analytics configured correctly, with ecommerce events properly tracked and connected to their ad platforms. This means the majority are making marketing decisions based on incomplete data.
Make sure yours is set up properly. Without correct ecommerce event tracking in GA4, your data is missing huge chunks of the customer journey.
Using Cohort Analysis to Understand Customer Retention
This is one of the more advanced features in Shopify Analytics that most merchants completely overlook and it’s genuinely powerful.
Cohort analysis groups customers by the time period when they made their first purchase and tracks their behavior over subsequent months. This is the most powerful analytical tool for understanding retention and customer lifetime value.
What this means in practice is that you can see for customers who first bought in January 2025, how many came back in February, March, April, and so on. If your cohort retention numbers are dropping fast, your products or brand experience have a retention problem. If they’re holding steady, you’re building a loyal customer base.
This data directly influences your marketing spend decisions. If you know that a customer who buys twice is worth 3x a one-time buyer, you invest in getting that second purchase through email marketing, loyalty programs, and post-purchase campaigns.
The Right Way to Use Shopify Analytics A Simple Framework
Let me give you a practical framework so this doesn’t just sit in your head as theory.
Daily (5 minutes) Check your overview dashboard. Look at sales vs. yesterday. Look at conversion rate. If anything looks unusual, dig in. Otherwise move on.
Weekly (30 minutes) Review your acquisition reports. Where did traffic come from? Which source converted best? Review your funnel report. Did any stage drop compared to last week? Review your top products report. Any surprises?
Monthly (1-2 hours) Look at customer reports. Are you growing your returning customer rate? Check your AOV trend. Is it moving up or down? Review your profit reports. Are you actually making money, not just generating revenue?
Quarterly Pull your cohort data. How are customers acquired 3 months ago performing now? Review year over year comparisons on your biggest metrics.
Start with one report. Master it. Act on what it tells you. Then add the next one. In four weeks, you will have a complete analytics practice that drives consistent improvement.
Other Analytics Tools Worth Considering
For most growing Shopify merchants, Shopify Analytics plus Google Analytics 4 is a solid foundation. But as you scale, here are a few others worth knowing:
TrueProfit This fills the net profit gap. It tracks your cost of goods sold, ad spend, and transaction fees alongside your revenue so you can see your actual profit margin in real time. Shopify doesn’t do this natively.
Hotjar If you want to see how people actually behave on your store through heatmaps and session recordings, Hotjar is the go to. You’ll see exactly where people click, where they scroll, and where they get stuck.
Triple Whale or Northbeam For brands running serious paid ad budgets across Meta, Google, and TikTok, these tools give you cross-channel attribution that neither Shopify nor GA4 does well on its own.
Just one word of caution every analytics script you load slows down your store. A 1-second delay in page load reduces conversions by 7%. Sites loading in 1 second achieve 3.05% conversion rates versus 0.67% at 4 seconds. And 53% of mobile visitors abandon a page that takes more than 3 seconds to load.
Don’t install every analytics tool you come across. Install what you actually use, and remove what you don’t.
Final Thoughts
Shopify Analytics is one of the most underused tools in any Shopify merchant’s toolkit. Most store owners log in, glance at the sales number, and leave. The ones who are growing fast are the ones actually reading their funnel data, tracking their customer cohorts, and making decisions based on what the numbers are telling them.
You don’t need to become a data scientist. You just need a consistent habit of checking the right numbers at the right frequency and then actually acting on what you find.
The translation of numbers on a screen into insights is methodical. Only when you know what you’re looking for can you turn your data into action.
Start with your overview dashboard. Then move to your funnel report. Then your acquisition reports. Build from there. Every metric you understand is another lever you can pull to grow your store.